Notice
Recent Posts
Recent Comments
Link
| 일 | 월 | 화 | 수 | 목 | 금 | 토 |
|---|---|---|---|---|---|---|
| 1 | 2 | 3 | 4 | 5 | 6 | 7 |
| 8 | 9 | 10 | 11 | 12 | 13 | 14 |
| 15 | 16 | 17 | 18 | 19 | 20 | 21 |
| 22 | 23 | 24 | 25 | 26 | 27 | 28 |
Tags
- 공부
- Pinpoint
- 코틀린 코루틴의 정석
- PETERICA
- tucker의 go 언어 프로그래밍
- SRE
- AWS EKS
- 바이브코딩
- LLM
- Kubernetes
- kotlin coroutine
- CloudWatch
- minikube
- go
- 기록으로 실력을 쌓자
- CKA 기출문제
- 오블완
- 정보처리기사 실기 기출문제
- aws
- kotlin
- AI
- Spring
- Rag
- APM
- Linux
- golang
- 티스토리챌린지
- CKA
- Java
- MySQL
Archives
- Today
- Total
피터의 개발이야기
[Grafana] 보안클라우드에 Grafana 설치 및 Redis 모니터링 본문
반응형

ㅁ개요
ㅇ 회사에서 APM으로 Whatap을 사용하고 있다. 하지만 레디스를 모니터링하는 부분이 부족하여 grafana를 이용하여 모니터링을 강화하기로 하였다.
ㅇ Grafana를 위한 pod 혹은 인스턴스를 생성할 수 없는 상황이었다. 그래서 운영Redis에 접근 가능한 보안클라우드에 window 버젼으로 Grafana를 설치하였고, 그 과정을 기록하였다.
ㅁ 인스톨 파일 준비 및 설치

- grafana windows를 인스톨 한다.
- redis datasource를 위해 my-plugin에 플러그인을 압축해제한다.

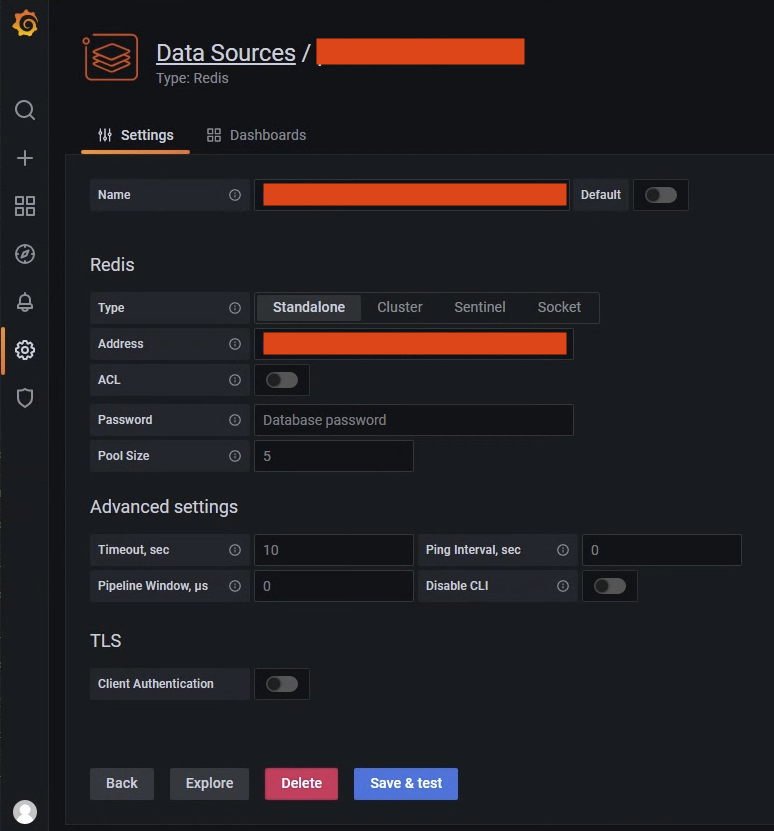
ㅁ Redis DataSource 설정

ㅇ main, sub redis datasouce를 설정하였다.
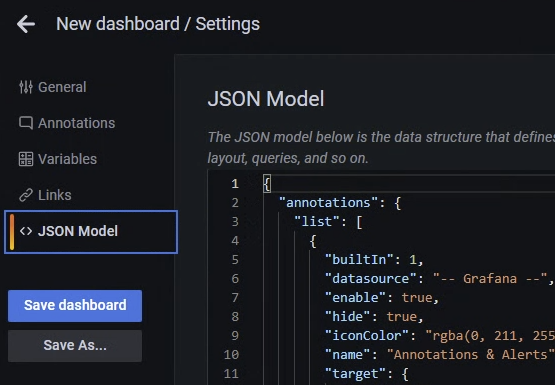
ㅁ Dashboar 설정
ㅇ new Dashboard

ㅇ Json Model을 저장한다.

{
"annotations": {
"list": [
{
"builtIn": 1,
"datasource": "-- Grafana --",
"enable": true,
"hide": true,
"iconColor": "rgba(0, 211, 255, 1)",
"name": "Annotations & Alerts",
"target": {
"limit": 100,
"matchAny": false,
"tags": [],
"type": "dashboard"
},
"type": "dashboard"
}
]
},
"editable": true,
"fiscalYearStartMonth": 0,
"graphTooltip": 0,
"id": 7,
"iteration": 1644371974521,
"links": [
{
"asDropdown": false,
"icon": "external link",
"includeVars": true,
"keepTime": true,
"tags": [
"redis"
],
"targetBlank": false,
"title": "Redis",
"tooltip": "",
"type": "dashboards",
"url": ""
}
],
"liveNow": false,
"panels": [
{
"datasource": {
"uid": "$redis"
},
"fieldConfig": {
"defaults": {
"color": {
"mode": "palette-classic"
},
"custom": {
"axisLabel": "",
"axisPlacement": "auto",
"barAlignment": 0,
"drawStyle": "line",
"fillOpacity": 51,
"gradientMode": "opacity",
"hideFrom": {
"legend": false,
"tooltip": false,
"viz": false
},
"lineInterpolation": "linear",
"lineWidth": 1,
"pointSize": 5,
"scaleDistribution": {
"type": "linear"
},
"showPoints": "never",
"spanNulls": true,
"stacking": {
"group": "A",
"mode": "none"
},
"thresholdsStyle": {
"mode": "off"
}
},
"mappings": [],
"thresholds": {
"mode": "absolute",
"steps": [
{
"color": "green",
"value": null
},
{
"color": "red",
"value": 80
}
]
},
"unit": "ops"
},
"overrides": []
},
"gridPos": {
"h": 7,
"w": 6,
"x": 0,
"y": 0
},
"id": 2,
"options": {
"legend": {
"calcs": [],
"displayMode": "hidden",
"placement": "bottom"
},
"tooltip": {
"mode": "multi"
}
},
"pluginVersion": "8.0.0",
"targets": [
{
"command": "info",
"query": "",
"refId": "A",
"section": "stats",
"streaming": true,
"streamingCapacity": 1000,
"streamingInterval": 1000,
"type": "command"
}
],
"title": "Ops/sec",
"transformations": [
{
"id": "filterFieldsByName",
"options": {
"include": {
"names": [
"instantaneous_ops_per_sec",
"#time"
]
}
}
}
],
"type": "timeseries"
},
{
"datasource": {
"uid": "$redis"
},
"fieldConfig": {
"defaults": {
"color": {
"mode": "palette-classic"
},
"custom": {
"axisLabel": "",
"axisPlacement": "auto",
"barAlignment": 0,
"drawStyle": "line",
"fillOpacity": 52,
"gradientMode": "opacity",
"hideFrom": {
"legend": false,
"tooltip": false,
"viz": false
},
"lineInterpolation": "linear",
"lineWidth": 1,
"pointSize": 5,
"scaleDistribution": {
"type": "linear"
},
"showPoints": "never",
"spanNulls": true,
"stacking": {
"group": "A",
"mode": "none"
},
"thresholdsStyle": {
"mode": "off"
}
},
"mappings": [],
"thresholds": {
"mode": "absolute",
"steps": [
{
"color": "green",
"value": null
},
{
"color": "red",
"value": 80
}
]
},
"unit": "decbytes"
},
"overrides": []
},
"gridPos": {
"h": 14,
"w": 6,
"x": 6,
"y": 0
},
"id": 7,
"options": {
"legend": {
"calcs": [
"mean",
"lastNotNull"
],
"displayMode": "table",
"placement": "bottom"
},
"tooltip": {
"mode": "multi"
}
},
"pluginVersion": "8.0.0",
"targets": [
{
"command": "info",
"query": "",
"refId": "A",
"section": "memory",
"streaming": true,
"streamingCapacity": 1000,
"streamingInterval": 1000,
"type": "command"
}
],
"title": "Memory",
"transformations": [
{
"id": "filterFieldsByName",
"options": {
"include": {
"names": [
"used_memory",
"used_memory_rss",
"used_memory_peak",
"total_system_memory",
"used_memory_lua",
"maxmemory",
"#time"
]
}
}
},
{
"id": "organize",
"options": {
"excludeByName": {},
"indexByName": {},
"renameByName": {
"maxmemory": "Memory Limit",
"total_system_memory": "Total System Memory",
"used_memory": "Used Memory",
"used_memory_lua": "Used Memory, LUA",
"used_memory_peak": "Used Memory, Peak",
"used_memory_rss": "Used Memory, RSS"
}
}
}
],
"type": "timeseries"
},
{
"datasource": {
"uid": "$redis"
},
"fieldConfig": {
"defaults": {
"custom": {
"align": "auto",
"displayMode": "color-text",
"filterable": false
},
"mappings": [],
"thresholds": {
"mode": "absolute",
"steps": [
{
"color": "green",
"value": null
}
]
}
},
"overrides": [
{
"matcher": {
"id": "byName",
"options": "Unique progressive identifier"
},
"properties": [
{
"id": "custom.width",
"value": 205
}
]
},
{
"matcher": {
"id": "byName",
"options": "Timestamp"
},
"properties": [
{
"id": "custom.width",
"value": 145
},
{
"id": "unit",
"value": "dateTimeFromNow"
}
]
},
{
"matcher": {
"id": "byName",
"options": "Duration"
},
"properties": [
{
"id": "custom.width",
"value": 92
}
]
},
{
"matcher": {
"id": "byName",
"options": "Command"
},
"properties": [
{
"id": "custom.width",
"value": 1185
}
]
}
]
},
"gridPos": {
"h": 15,
"w": 12,
"x": 12,
"y": 0
},
"id": 11,
"options": {
"footer": {
"fields": "",
"reducer": [
"sum"
],
"show": false
},
"showHeader": true,
"sortBy": []
},
"pluginVersion": "8.3.1",
"targets": [
{
"command": "slowlogGet",
"query": "",
"refId": "A",
"type": "command"
}
],
"title": "Slow queries log",
"transformations": [
{
"id": "organize",
"options": {
"excludeByName": {
"Id": true,
"Timestamp": false
},
"indexByName": {
"Command": 4,
"Duration": 3,
"Id": 0,
"Timestamp": 1,
"Timestamp * 1000": 2
},
"renameByName": {
"Duration": "",
"Id": "Id",
"Timestamp * 1000": "Timestamp"
}
}
}
],
"type": "table"
},
{
"datasource": {
"type": "datasource",
"uid": "-- Dashboard --"
},
"fieldConfig": {
"defaults": {
"color": {
"mode": "palette-classic"
},
"custom": {
"axisLabel": "",
"axisPlacement": "auto",
"barAlignment": 0,
"drawStyle": "line",
"fillOpacity": 52,
"gradientMode": "opacity",
"hideFrom": {
"legend": false,
"tooltip": false,
"viz": false
},
"lineInterpolation": "linear",
"lineWidth": 1,
"pointSize": 5,
"scaleDistribution": {
"type": "linear"
},
"showPoints": "never",
"spanNulls": true,
"stacking": {
"group": "A",
"mode": "none"
},
"thresholdsStyle": {
"mode": "off"
}
},
"mappings": [],
"thresholds": {
"mode": "absolute",
"steps": [
{
"color": "green",
"value": null
},
{
"color": "red",
"value": 80
}
]
},
"unit": "KBs"
},
"overrides": []
},
"gridPos": {
"h": 7,
"w": 6,
"x": 0,
"y": 7
},
"id": 5,
"options": {
"legend": {
"calcs": [
"mean",
"lastNotNull"
],
"displayMode": "table",
"placement": "bottom"
},
"tooltip": {
"mode": "multi"
}
},
"pluginVersion": "8.0.0",
"targets": [
{
"panelId": 2,
"refId": "A"
}
],
"title": "Network",
"transformations": [
{
"id": "filterFieldsByName",
"options": {
"include": {
"names": [
"instantaneous_input_kbps",
"instantaneous_output_kbps",
"#time"
]
}
}
},
{
"id": "organize",
"options": {
"excludeByName": {},
"indexByName": {},
"renameByName": {
"instantaneous_input_kbps": "Input",
"instantaneous_output_kbps": "Output"
}
}
}
],
"type": "timeseries"
},
{
"datasource": {
"uid": "$redis"
},
"gridPos": {
"h": 15,
"w": 12,
"x": 0,
"y": 14
},
"id": 29,
"options": {
"hideZero": true,
"interval": 1000,
"maxItemsPerSeries": 300,
"viewMode": "Graph"
},
"pluginVersion": "7.3.7",
"title": "Latency",
"type": "redis-latency-panel"
},
{
"datasource": {
"uid": "$redis"
},
"gridPos": {
"h": 15,
"w": 12,
"x": 12,
"y": 15
},
"id": 25,
"options": {
"interval": 1000
},
"pluginVersion": "7.3.7",
"title": "Keys consuming a lot of memory (LATENCY MAY INCREASE - USE OFF-PEAK)",
"type": "redis-keys-panel"
},
{
"datasource": {
"uid": "$redis"
},
"gridPos": {
"h": 13,
"w": 12,
"x": 0,
"y": 29
},
"id": 23,
"options": {
"height": 20,
"help": {
"since": "2.2.12",
"summary": "Manages the Redis slow queries log.",
"syntax": "SLOWLOG subcommand [argument]",
"url": "https://redis.io/commands/slowlog"
},
"output": "Redis-dev> slowlog get 10\n288\n1639369592\n13702\nPEXPIRE\nRedisCmdHealthcheck\n10\n13.124.106.81:65391\n\n287\n1639027621\n23264\nZRANGEBYSCORE\nRCS_Z_A2P_DAK\n0.0\n1.638768421415E12\nLIMIT\n0\n10000\n13.124.106.81:52600\n\n286\n1638843657\n23142\nHSCAN\nRCS_H_A2P_MSG\n0\nCOUNT\n10000\n182.216.241.147:65504\n\n285\n1638843620\n18678\nHSCAN\nRCS_H_A2P_MSG\n0\nCOUNT\n10000\n182.216.241.147:65504\n\n284\n1638433380\n12752\nSMEMBERS\nrcs-admin:session:expirations:1638433380000\n13.124.106.81:29792\n\n283\n1638321309\n21078\nHSCAN\nRCS_H_A2P_MSG\n0\nMATCH\nEE*\nCOUNT\n20000\n106.246.229.114:61656\n\n282\n1638321280\n30723\nHSCAN\nRCS_H_A2P_MSG\n0\nMATCH\nEE*\nCOUNT\n10000\n106.246.229.114:61656\n\n281\n1638251100\n18528\nZREMRANGEBYSCORE\nRCS_Z_RS_MSG_DUP_CHECK\n0.0\n1.638250499999E12\n13.124.106.81:1507\n\n280\n1637735569\n23050\nhgetall\nRCS_H_A2P_MSG\n106.246.229.114:63374\n\n279\n1637735485\n41894\nhgetall\nRCS_H_A2P_MSG\n106.246.229.114:63154\n\nprd-rcs-main> slowlog get\n6654\n1643960166\n11988\nZRANGEBYSCORE\nRCS_Z_FB_SMS_DAK_3\n0.0\n1.643672166069E12\nLIMIT\n0\n10000\n172.20.213.183:51028\n\n6653\n1643958745\n10892\nHSCAN\nRCS_H_A2P_STAT_MIN\n13754\nMATCH\n2022020415*\nCOUNT\n100\n172.20.213.183:51028\n",
"query": "",
"raw": true
},
"pluginVersion": "7.2.1",
"targets": [
{
"command": "",
"query": "ping",
"refId": "A",
"section": "commandstats",
"streaming": false,
"type": "cli"
}
],
"title": "Redis CLI",
"transformations": [],
"type": "redis-cli-panel"
}
],
"refresh": "",
"schemaVersion": 33,
"style": "dark",
"tags": [],
"templating": {
"list": [
{
"current": {
"selected": false,
"text": "prd-rcs-main",
"value": "prd-rcs-main"
},
"hide": 0,
"includeAll": false,
"label": "Redis",
"multi": false,
"name": "redis",
"options": [],
"query": "redis-datasource",
"queryValue": "",
"refresh": 1,
"regex": "",
"skipUrlSync": false,
"type": "datasource"
}
]
},
"time": {
"from": "now-5m",
"to": "now"
},
"timepicker": {
"refresh_intervals": [
"5s",
"10s",
"30s",
"1m",
"5m",
"15m",
"30m",
"1h",
"2h",
"1d"
]
},
"timezone": "",
"title": "Redis CLI3",
"uid": "iSDaH7a7z",
"version": 6,
"weekStart": ""
}ㅁ DashBoard를 통해 Redis 상황모니터링

- 네트워크 상황
- Redis cmd 별 지연상황
- Slow queries 확인
- Redis 메모니 사용현황
- Redis key별 용량확인
ㅁ Redis CLI를 통한 내부 테이터 및 상황확인

- Grafana의 UI상에서 Redis command를 직접 입력할 수 있다.
반응형
'DevOps > Grafana' 카테고리의 다른 글
| [Grafana] grafana k6로 테스트 환경 구성(grafana, influxdb, k6) (0) | 2024.10.31 |
|---|---|
| [Grafana] grafana를 helm으로 설치하기 (0) | 2023.01.28 |
Comments


