
- 분류 전체보기 (859)

| 일 | 월 | 화 | 수 | 목 | 금 | 토 |
|---|---|---|---|---|---|---|
| 1 | 2 | 3 | 4 | 5 | ||
| 6 | 7 | 8 | 9 | 10 | 11 | 12 |
| 13 | 14 | 15 | 16 | 17 | 18 | 19 |
| 20 | 21 | 22 | 23 | 24 | 25 | 26 |
| 27 | 28 | 29 | 30 |
- 오블완
- Java
- AWS EKS
- 정보처리기사 실기 기출문제
- go
- AI
- aws
- 티스토리챌린지
- 정보처리기사실기 기출문제
- PETERICA
- 기록으로 실력을 쌓자
- Elasticsearch
- kotlin coroutine
- docker
- 공부
- kotlin
- 코틀린 코루틴의 정석
- Spring
- golang
- CKA
- CloudWatch
- minikube
- mysql 튜닝
- Linux
- APM
- kotlin querydsl
- Kubernetes
- tucker의 go 언어 프로그래밍
- CKA 기출문제
- Pinpoint
- Today
- Total
피터의 개발이야기
[Grafana] grafana를 helm으로 설치하기 본문

ㅁ 개요
ㅇ Helm 차트를 이용하여 Grafana를 설치하는 과정을 정리하였다.
ㅇ 로컬환경(Docker Desktop)에 구성된 kubernetes 환경에서 설치하였다.
ㅁ Grafana의 Helm Repository 추가
$ helm repo add grafana https://grafana.github.io/helm-charts
"grafana" has been added to your repositories
ㅇ Grafana 설치를 위해 Helm Repository를 추가한다.
ㅁ Grafana Helm Chart를 다운로드
$ git clone https://github.com/grafana/helm-charts.git
Cloning into 'helm-charts'...
remote: Enumerating objects: 29996, done.
remote: Counting objects: 100% (106/106), done.
remote: Compressing objects: 100% (54/54), done.
remote: Total 29996 (delta 54), reused 92 (delta 52), pack-reused 29890
Receiving objects: 100% (29996/29996), 18.43 MiB | 10.62 MiB/s, done.
Resolving deltas: 100% (21046/21046), done.
ㅁ admin 계정정보 설정

ㅇ values.yaml의 위치는 다운로드한 Helm Chart 폴더(helm-charts/charts/grafana)에 있다.
$ vi values.yaml

...

# Administrator credentials when not using an existing secret (see below)
adminUser: admin
adminPassword: strongpassword

...
ㅇ 어드민의 비밀번호를 설정한다.
ㅁ 서비스 접속을 위한 NodePort 설정
## Expose the grafana service to be accessed from outside the cluster (LoadBalancer service).
## or access it from within the cluster (ClusterIP service). Set the service type and the port to serve it.
## ref: http://kubernetes.io/docs/user-guide/services/
##
service:
  enabled: true
  type: NodePort
  port: 80
  targetPort: 3000
    # targetPort: 4181 To be used with a proxy extraContainer
  ## Service annotations. Can be templated.
  annotations: {}
  labels: {}
  portName: service
  # Adds the appProtocol field to the service. This allows to work with istio protocol selection. Ex: "http" or "tcp"
  appProtocol: ""
ㅇ 로컬환경(Docker Desktop)에서 접속을 하기 위해서는 service type을 NodePort로 변경해야 한다.
ㅁ Monitor 네임스페이스 생성
$ kubectl create namespace monitor
namespace/monitor created
ㅁ 설치 & 트버블슈팅
$ helm install gfn grafana/grafana -f values.yaml --namespace monitor ✔ 5538 14:08:33
NAME: gfn
LAST DEPLOYED: Sun Jan 29 08:39:57 2023
NAMESPACE: monitor
STATUS: deployed
REVISION: 1
NOTES:
1. Get your 'admin' user password by running:
kubectl get secret --namespace monitor gfn-grafana -o jsonpath="{.data.admin-password}" | base64 --decode ; echo
2. The Grafana server can be accessed via port 80 on the following DNS name from within your cluster:
gfn-grafana.monitor.svc.cluster.local
Get the Grafana URL to visit by running these commands in the same shell:
export NODE_PORT=$(kubectl get --namespace monitor -o jsonpath="{.spec.ports[0].nodePort}" services gfn-grafana)
export NODE_IP=$(kubectl get nodes --namespace monitor -o jsonpath="{.items[0].status.addresses[0].address}")
echo http://$NODE_IP:$NODE_PORT
3. Login with the password from step 1 and the username: admin
#################################################################################
###### WARNING: Persistence is disabled!!! You will lose your data when #####
###### the Grafana pod is terminated. #####
#################################################################################ㅇ 경고가 발생하여 확인을 하였다.
WARNING: Persistence is disabled!!! You will lose your data when the Grafana pod is terminated.
경고: 지속성이 비활성화되었습니다!!! Grafana 포드가 종료되면 데이터가 손실됩니다.
ㅇ 볼륨의 지속성이 비활성화 되어 있어서 데이터가 손실될 수 있다는 내용이었다.
ㅇ https://github.com/easzlab/kubeasz/issues/373 이곳을 참조하여 조취를 하였다.
## Enable persistence using Persistent Volume Claims
## ref: http://kubernetes.io/docs/user-guide/persistent-volumes/
##
persistence:
  type: pvc
  enabled: true   << 수정함.
  # storageClassName: default
  accessModes:
    - ReadWriteOnce
  size: 10Gi
ㅇ values.yaml에서 persistence을 활성화 하였다.
ㅇ 수정된 values.yaml을 적용하기 위해서는 업그레이드 과정이 필요하다.
ㅁ helm 업그레이드
$ helm upgrade gfn grafana/grafana -f values.yaml --namespace monitor
Release "gfn" has been upgraded. Happy Helming!
NAME: gfn
LAST DEPLOYED: Sun Jan 29 08:41:54 2023
NAMESPACE: monitor
STATUS: deployed
REVISION: 2
NOTES:
1. Get your 'admin' user password by running:

   kubectl get secret --namespace monitor gfn-grafana -o jsonpath="{.data.admin-password}" | base64 --decode ; echo

2. The Grafana server can be accessed via port 80 on the following DNS name from within your cluster:

   gfn-grafana.monitor.svc.cluster.local

   Get the Grafana URL to visit by running these commands in the same shell:
     export NODE_PORT=$(kubectl get --namespace monitor -o jsonpath="{.spec.ports[0].nodePort}" services gfn-grafana)
     export NODE_IP=$(kubectl get nodes --namespace monitor -o jsonpath="{.items[0].status.addresses[0].address}")
     echo http://$NODE_IP:$NODE_PORT

3. Login with the password from step 1 and the username: admin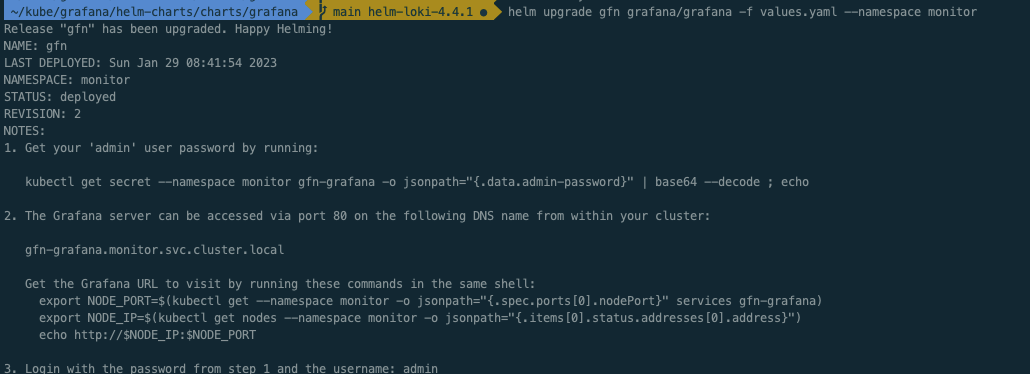
ㅇ 수정된 내용을 반영하기 위해 업그레이드를 진행하였다.
ㅇ 볼륨에 관한 경고는 사라졌다.
ㅁ Grafana 웹 접근을 위한 Service 확인
$ kubectl get svc -o wide -n monitor
NAME          TYPE       CLUSTER-IP     EXTERNAL-IP   PORT(S)        AGE     SELECTOR
gfn-grafana   NodePort   10.97.143.47   <none>        80:30326/TCP   5h42m   app.kubernetes.io/instance=gfn,app.kubernetes.io/name=grafana
ㅇ NodePort로 되어 있기 때문에 localhost:30326으로 접근하염 grafana를 접근할 수 있다.
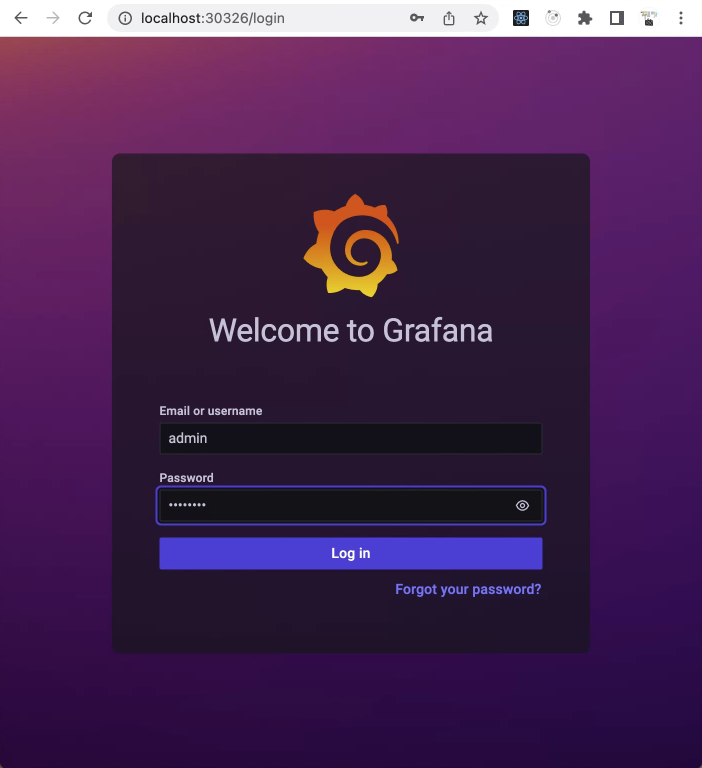
ㅇ value.yaml에 설정한 비밀번호와 아이디를 입력하여 로그인한다.
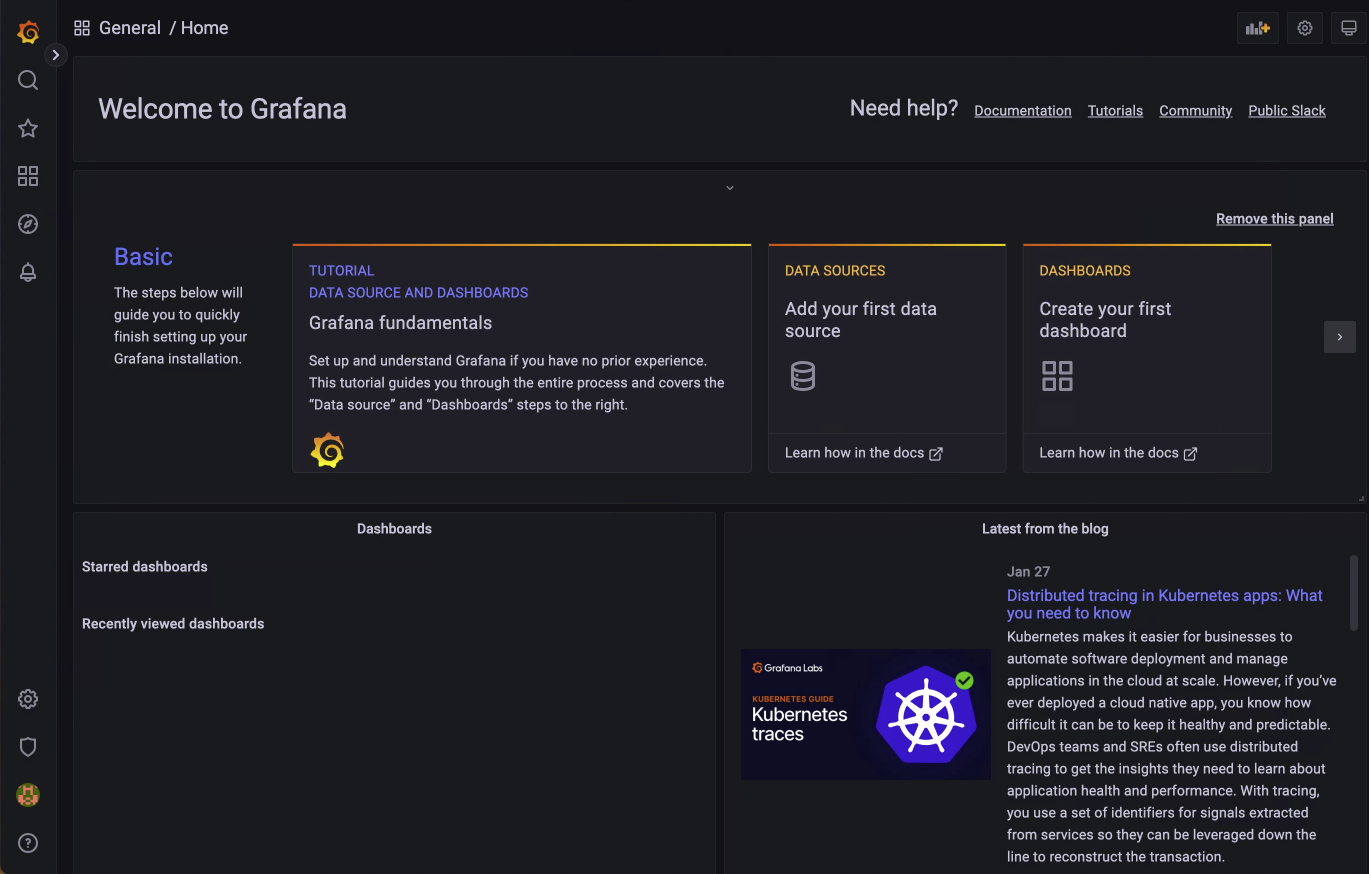
ㅇ 메인페이지에 정상 접근하였다.
ㅁ 함께 보면 좋은 사이트
GitHub - resmoio/kubernetes-event-exporter: Export Kubernetes events to multiple destinations with routing and filtering
Export Kubernetes events to multiple destinations with routing and filtering - GitHub - resmoio/kubernetes-event-exporter: Export Kubernetes events to multiple destinations with routing and filtering
github.com
ㅇ 소멸되는 kubernetes event를 elasticsearch나 다른 매체로 export해줌.
'DevOps > Grafana' 카테고리의 다른 글
| [Grafana] grafana k6로 테스트 환경 구성(grafana, influxdb, k6) (0) | 2024.10.31 |
|---|---|
| [Grafana] 보안클라우드에 Grafana 설치 및 Redis 모니터링 (0) | 2022.05.13 |

