
- 분류 전체보기 (976)

| 일 | 월 | 화 | 수 | 목 | 금 | 토 |
|---|---|---|---|---|---|---|
| 1 | 2 | 3 | 4 | 5 | 6 | 7 |
| 8 | 9 | 10 | 11 | 12 | 13 | 14 |
| 15 | 16 | 17 | 18 | 19 | 20 | 21 |
| 22 | 23 | 24 | 25 | 26 | 27 | 28 |
- 코틀린 코루틴의 정석
- go
- MySQL
- PETERICA
- Rag
- CKA 기출문제
- aws
- 바이브코딩
- 기록으로 실력을 쌓자
- Linux
- 정보처리기사 실기 기출문제
- AWS EKS
- 티스토리챌린지
- minikube
- golang
- SRE
- 오블완
- CloudWatch
- Java
- kotlin coroutine
- 공부
- Spring
- APM
- AI
- LLM
- Pinpoint
- tucker의 go 언어 프로그래밍
- CKA
- kotlin
- Kubernetes
- Today
- Total
피터의 개발이야기
[Elasticsearch] EFK 설치(minikube)-2 본문

ㅁ 관련 글
ㅇ [Elasticsearch] EFK(Elasticsearch, Fluentd, kibana)란
ㅇ [Elasticsearch] EFK 설치(minikube)-1
ㅇ [Elasticsearch] EFK 설치(minikube)-2
ㅁ 개요
ㅇ 지난 시간에 [Elasticsearch] EFK 설치(minikube)-1 과정에서 이러지는 내용이다.
ㅇ 소스는 여기에 있음.
ㅁ kibana.yaml
apiVersion: apps/v1
kind: Deployment
metadata:
  name: kibana
  namespace: elastic
  labels:
    app: kibana
spec:
  replicas: 1
  selector:
    matchLabels:
      app: kibana
  template:
    metadata:
      labels:
        app: kibana
    spec:
      containers:
      - name: kibana
        image: docker.elastic.co/kibana/kibana:7.2.0
        resources:
          limits:
            cpu: 2000m
          requests:
            cpu: 100m
        env:
          - name: ELASTICSEARCH_HOSTS
            value: http://elasticsearch-svc:9200
        ports:
        - containerPort: 5601
---
apiVersion: v1
kind: Service
metadata:
  labels:
    app: kibana
  name: kibana-svc
  namespace: elastic
spec:
  ports:
  - nodePort: 30561
    port: 5601
    protocol: TCP
    targetPort: 5601
  selector:
    app: kibana
  type: NodePort
ㅁ Kibana 배포

# kibana 설치
~/study/aws/EFK-minikube/EFK > kubectl apply -f kibana.yaml
deployment.apps/kibana created
service/kibana-svc created

# 설치 확인
~/study/aws/EFK-minikube/EFK > kubectl get all -n elastic
NAME                          READY   STATUS    RESTARTS      AGE
pod/elasticsearch-0           1/1     Running   1 (55m ago)   2d23h
pod/kibana-59677ff7bd-mg98q   1/1     Running   0             32s

NAME                        TYPE       CLUSTER-IP       EXTERNAL-IP   PORT(S)                         AGE
service/elasticsearch-svc   NodePort   10.107.40.25     <none>        9200:30920/TCP,9300:30930/TCP   2d23h
service/kibana-svc          NodePort   10.108.172.120   <none>        5601:30561/TCP                  32s

NAME                     READY   UP-TO-DATE   AVAILABLE   AGE
deployment.apps/kibana   1/1     1            1           32s

NAME                                DESIRED   CURRENT   READY   AGE
replicaset.apps/kibana-59677ff7bd   1         1         1       32s

NAME                             READY   AGE
statefulset.apps/elasticsearch   1/1     2d23h
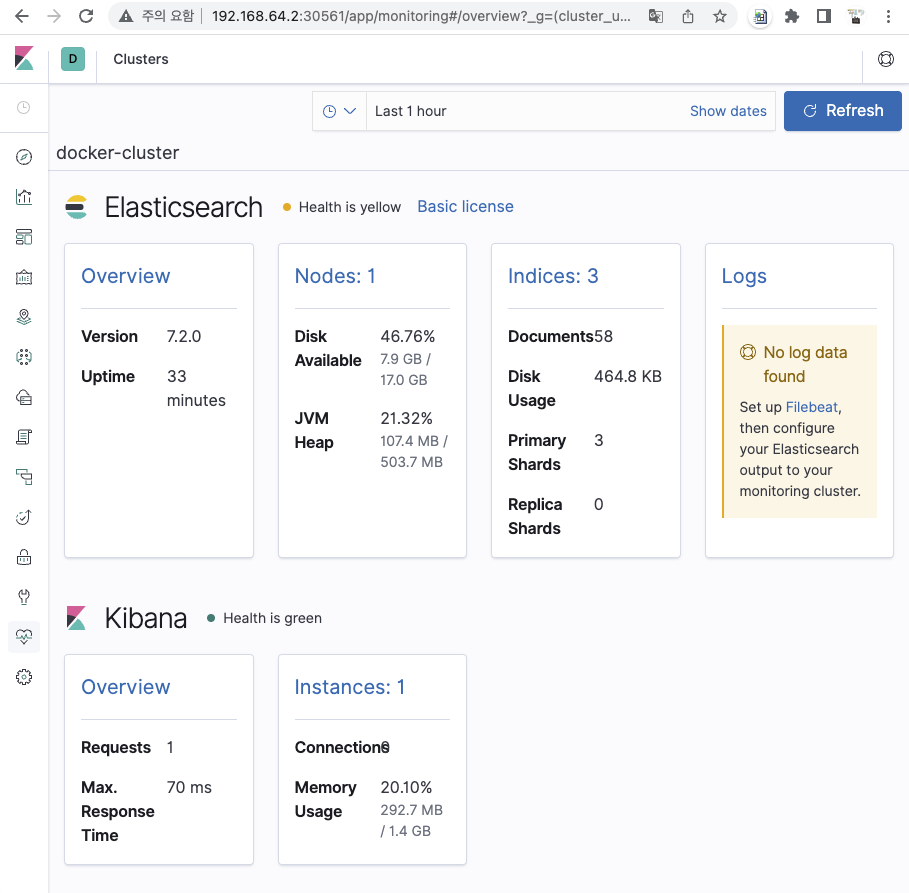
ㅁ kibana 접속 URL 확인 및 접속 확인


ㅁ Fluentd.yaml
ㅇ fluentd는 모든 node에서 log를 수집해야 하기 때문에 Daemonset으로 배포되어야한다.
apiVersion: v1
kind: ServiceAccount
metadata:
  name: fluentd
  namespace: elastic

---
apiVersion: rbac.authorization.k8s.io/v1
kind: ClusterRole
metadata:
  name: fluentd
rules:
  - apiGroups:
      - ""
    resources:
      - pods
      - namespaces
    verbs:
      - get
      - list
      - watch

---
kind: ClusterRoleBinding
apiVersion: rbac.authorization.k8s.io/v1
metadata:
  name: fluentd
roleRef:
  kind: ClusterRole
  name: fluentd
  apiGroup: rbac.authorization.k8s.io
subjects:
  - kind: ServiceAccount
    name: fluentd
    namespace: elastic
---
apiVersion: apps/v1
kind: DaemonSet
metadata:
  name: fluentd
  namespace: elastic
  labels:
    k8s-app: fluentd-logging
    version: v1
spec:
  selector:
    matchLabels:
      k8s-app: fluentd-logging
      version: v1
  template:
    metadata:
      labels:
        k8s-app: fluentd-logging
        version: v1
    spec:
      serviceAccount: fluentd
      serviceAccountName: fluentd
      tolerations:
        - key: node-role.kubernetes.io/master
          effect: NoSchedule
      containers:
        - name: fluentd
          image: fluent/fluentd-kubernetes-daemonset:v1-debian-elasticsearch
          env:
            - name:  FLUENT_ELASTICSEARCH_HOST
              value: "elasticsearch-svc"
            - name:  FLUENT_ELASTICSEARCH_PORT
              value: "9200"
            - name: FLUENT_ELASTICSEARCH_SCHEME
              value: "http"
          resources:
            limits:
              memory: 200Mi
            requests:
              cpu: 100m
              memory: 200Mi
          volumeMounts:
            - name: varlog
              mountPath: /var/log
            - name: varlibdockercontainers
              mountPath: /var/lib/docker/containers
              readOnly: true
      terminationGracePeriodSeconds: 30
      volumes:
        - name: varlog
          hostPath:
            path: /var/log
        - name: varlibdockercontainers
          hostPath:
            path: /var/lib/docker/containers
ㅁ datree 테스트

$ datree test fluentd.yaml
>>  File: fluentd.yaml

[V] YAML validation
[V] Kubernetes schema validation

[X] Policy check

❌  Ensure each container has a configured CPU limit  [1 occurrence]
    - metadata.name: fluentd (kind: DaemonSet)
💡  Missing property object `limits.cpu` - value should be within the accepted boundaries recommended by the organization

❌  Ensure each container has a configured liveness probe  [1 occurrence]
    - metadata.name: fluentd (kind: DaemonSet)
💡  Missing property object `livenessProbe` - add a properly configured livenessProbe to catch possible deadlocks

❌  Ensure each container has a configured readiness probe  [1 occurrence]
    - metadata.name: fluentd (kind: DaemonSet)
💡  Missing property object `readinessProbe` - add a properly configured readinessProbe to notify kubelet your Pods are ready for traffic


(Summary)

- Passing YAML validation: 1/1

- Passing Kubernetes (1.20.0) schema validation: 1/1

- Passing policy check: 0/1

+-----------------------------------+-----------------------+
| Enabled rules in policy "Default" | 21                    |
| Configs tested against policy     | 4                     |
| Total rules evaluated             | 21                    |
| Total rules skipped               | 0                     |
| Total rules failed                | 3                     |
| Total rules passed                | 18                    |
| See all rules in policy           | https://app.datree.io |
+-----------------------------------+-----------------------+
ㅇ limits.cpu 설정이 빠졌을 때에 시스템에서 권장하는 허용 범위로 설정하도록 권장하고 있다.
ㅇ deadlocks 상태를 포착하기 위해 적절하게 구성된 livenessProbe를 추가하도록 권장한다.
ㅇ 적절하게 구성된 readyinessProbe를 추가하여 Pod가 트래픽에 대한 준비가 되었음을 kubelet에 알립니다.
ㅁ fluentd 배포
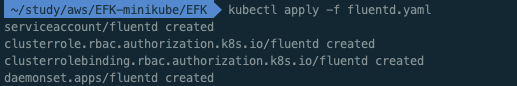
$ kubectl apply -f fluentd.yaml
serviceaccount/fluentd created
clusterrole.rbac.authorization.k8s.io/fluentd created
clusterrolebinding.rbac.authorization.k8s.io/fluentd created
daemonset.apps/fluentd created
ㅁ fluentd 설치 확인

$ kubectl describe -n elastic pods/fluentd-88brn
Name:         fluentd-88brn
Namespace:    elastic
Priority:     0
Node:         minikube/192.168.64.2
Start Time:   Mon, 15 Aug 2022 11:58:56 +0900
Labels:       controller-revision-hash=59d944c78d
              k8s-app=fluentd-logging
              pod-template-generation=1
              version=v1
Annotations:  <none>
Status:       Running
IP:           172.17.0.14
IPs:
  IP:           172.17.0.14
Controlled By:  DaemonSet/fluentd
Containers:
  fluentd:
    Container ID:   docker://07d19cdd0f96c528772388452d5f4dcaf366d823320c2476c8501c751d07efd5
    Image:          fluent/fluentd-kubernetes-daemonset:v1-debian-elasticsearch
    Image ID:       docker-pullable://fluent/fluentd-kubernetes-daemonset@sha256:86e399bcbf77fe3435abb77d7069a8fc7fe6d451b918f7627fa3ed76059e6275
    Port:           <none>
    Host Port:      <none>
    State:          Running
      Started:      Mon, 15 Aug 2022 11:58:58 +0900
    Ready:          True
    Restart Count:  0
    Limits:
      memory:  200Mi
    Requests:
      cpu:     100m
      memory:  200Mi
    Environment:
      FLUENT_ELASTICSEARCH_HOST:    elasticsearch-svc
      FLUENT_ELASTICSEARCH_PORT:    9200
      FLUENT_ELASTICSEARCH_SCHEME:  http
    Mounts:
      /var/lib/docker/containers from varlibdockercontainers (ro)
      /var/log from varlog (rw)
      /var/run/secrets/kubernetes.io/serviceaccount from kube-api-access-mxq8v (ro)
Conditions:
  Type              Status
  Initialized       True
  Ready             True
  ContainersReady   True
  PodScheduled      True
Volumes:
  varlog:
    Type:          HostPath (bare host directory volume)
    Path:          /var/log
    HostPathType:
  varlibdockercontainers:
    Type:          HostPath (bare host directory volume)
    Path:          /var/lib/docker/containers
    HostPathType:
  kube-api-access-mxq8v:
    Type:                    Projected (a volume that contains injected data from multiple sources)
    TokenExpirationSeconds:  3607
    ConfigMapName:           kube-root-ca.crt
    ConfigMapOptional:       <nil>
    DownwardAPI:             true
QoS Class:                   Burstable
Node-Selectors:              <none>
Tolerations:                 node-role.kubernetes.io/master:NoSchedule
                             node.kubernetes.io/disk-pressure:NoSchedule op=Exists
                             node.kubernetes.io/memory-pressure:NoSchedule op=Exists
                             node.kubernetes.io/not-ready:NoExecute op=Exists
                             node.kubernetes.io/pid-pressure:NoSchedule op=Exists
                             node.kubernetes.io/unreachable:NoExecute op=Exists
                             node.kubernetes.io/unschedulable:NoSchedule op=Exists
Events:
  Type    Reason     Age    From               Message
  ----    ------     ----   ----               -------
  Normal  Scheduled  2m15s  default-scheduler  Successfully assigned elastic/fluentd-88brn to minikube
  Normal  Pulled     2m15s  kubelet            Container image "fluent/fluentd-kubernetes-daemonset:v1-debian-elasticsearch" already present on machine
  Normal  Created    2m14s  kubelet            Created container fluentd
  Normal  Started    2m14s  kubelet            Started container fluentd
ㅇ fluentd가 정상적으로 세팅됨을 확인하였다.
ㅇ 이제 수집된 로그를 kibana에 연결하는 마무리 작업을 해줘야한다.
ㅁ Kibana Index 설정

ㅇ Management / Index patterns로 이동한다.
ㅇ 오른쪽 상단의 Create index pattern을 클릭한다.

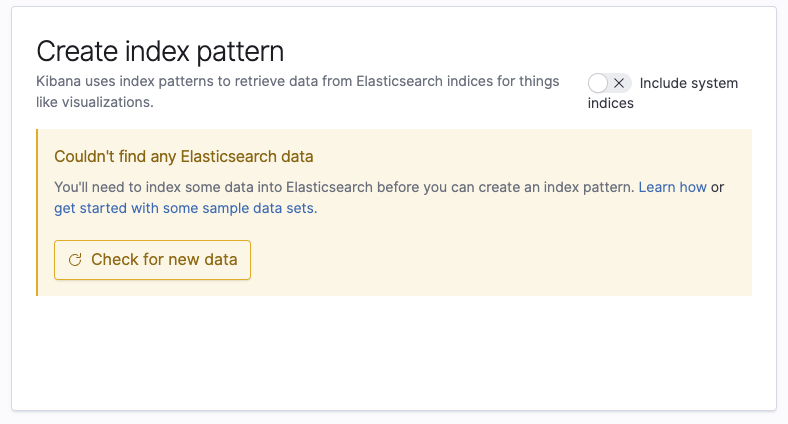
ㅇ 인덱스를 생성하려 하였지만 elasticsearch에 데이터가 모이지 않는다는 경고를 확인하였다.
ㅇ 왜 로그가 수집이 되지 않을까? 트러블슈팅을 해야한다.
ㅁ Fluentd log 확인
$ kubectl logs  -n elastic fluentd-88brn
2022-08-15 03:38:52 +0000 [warn]: #0 [in_systemd_docker] Systemd::JournalError: No such file or directory retrying in 1s
2022-08-15 03:38:52 +0000 [warn]: #0 [in_systemd_bootkube] Systemd::JournalError: No such file or directory retrying in 1s
2022-08-15 03:38:52 +0000 [warn]: #0 [in_systemd_kubelet] Systemd::JournalError: No such file or directory retrying in 1s
2022-08-15 03:38:53 +0000 [warn]: #0 [in_systemd_docker] Systemd::JournalError: No such file or directory retrying in 1s
2022-08-15 03:38:53 +0000 [warn]: #0 [in_systemd_bootkube] Systemd::JournalError: No such file or directory retrying in 1s
2022-08-15 03:38:53 +0000 [warn]: #0 [in_systemd_kubelet] Systemd::JournalError: No such file or directory retrying in 1s
2022-08-15 03:38:54 +0000 [warn]: #0 [in_systemd_bootkube] Systemd::JournalError: No such file or directory retrying in 1s
2022-08-15 03:38:54 +0000 [warn]: #0 [in_systemd_kubelet] Systemd::JournalError: No such file or directory retrying in 1s
2022-08-15 03:38:54 +0000 [warn]: #0 [in_systemd_docker] Systemd::JournalError: No such file or directory retrying in 1s
2022-08-15 03:38:55 +0000 [warn]: #0 [in_systemd_docker] Systemd::JournalError: No such file or directory retrying in 1s
2022-08-15 03:38:55 +0000 [warn]: #0 [in_systemd_bootkube] Systemd::JournalError: No such file or directory retrying in 1s
2022-08-15 03:38:55 +0000 [warn]: #0 [in_systemd_kubelet] Systemd::JournalError: No such file or directory retrying in 1s
2022-08-15 03:38:56 +0000 [warn]: #0 [in_systemd_docker] Systemd::JournalError: No such file or directory retrying in 1s
2022-08-15 03:38:56 +0000 [warn]: #0 [in_systemd_bootkube] Systemd::JournalError: No such file or directory retrying in 1s
2022-08-15 03:38:56 +0000 [warn]: #0 [in_systemd_kubelet] Systemd::JournalError: No such file or directory retrying in 1s
2022-08-15 03:38:57 +0000 [warn]: #0 [in_systemd_docker] Systemd::JournalError: No such file or directory retrying in 1s
2022-08-15 03:38:57 +0000 [warn]: #0 [in_systemd_kubelet] Systemd::JournalError: No such file or directory retrying in 1s
2022-08-15 03:38:57 +0000 [warn]: #0 [in_systemd_bootkube] Systemd::JournalError: No such file or directory retrying in 1s
ㅇ No such file or directory retrying in 1s 라는 경고가 지속적으로 발생하고 있었다.
ㅇ 구글링 하여 해답을 찾았다. 여기서
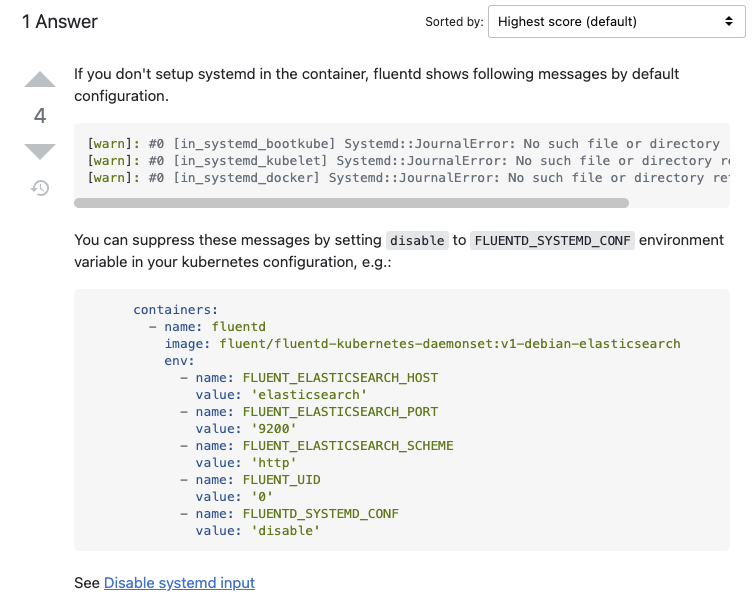

ㅇ 환경변수를 수정하여 저장하였다.

$ kubectl apply -f fluentd.yaml
serviceaccount/fluentd unchanged
clusterrole.rbac.authorization.k8s.io/fluentd unchanged
clusterrolebinding.rbac.authorization.k8s.io/fluentd unchanged
daemonset.apps/fluentd configured
ㅇ 다시 배포하였다.
ㅁ fluentd log 확인
$ kubectl logs -n elastic fluentd-5gxmv
~~~~
2022-08-15 04:29:59 +0000 [info]: #0 [in_tail_container_logs] following tail of /var/log/containers/prometheus-prometheus-kube-prometheus-prometheus-0_default_prometheus-3e8b55e6ec69d3223f434f3d5d427672e0126de8ccf64458595d07cf1e9b6b12.log
2022-08-15 04:29:59 +0000 [info]: #0 [in_tail_container_logs] following tail of /var/log/containers/prometheus-prometheus-node-exporter-29jqm_default_node-exporter-47c5e701ab033be55b66f5dcb4e88d9e0c05700795b533d60584bc7698011c6c.log
2022-08-15 04:29:59 +0000 [info]: #0 [in_tail_container_logs] following tail of /var/log/containers/prometheus-prometheus-node-exporter-29jqm_default_node-exporter-8dc97700d1f021fa93473a5a34e24c8602fe4bae5069ba4837f7680557826aca.log
2022-08-15 04:29:59 +0000 [info]: #0 [in_tail_container_logs] following tail of /var/log/containers/storage-provisioner_kube-system_storage-provisioner-570d406520ded063cad24c63f1baf2982bcf670ba4b09ae7cd466c45939225fd.log
2022-08-15 04:29:59 +0000 [info]: #0 [in_tail_container_logs] following tail of /var/log/containers/storage-provisioner_kube-system_storage-provisioner-f91f3e5bc9630c29c7ed4e630184b6fbb7e4c4372c168ee7bc38bea89a41cb99.log
2022-08-15 04:29:59 +0000 [info]: #0 fluentd worker is now running worker=0
ㅇ 더 이상의 이상 로그는 발생하지 않았다.
ㅇ kibana 로그는 일시적 현상이었는데, 결과적으로 엉뚱하게 불필요한 시스템 로그를 제거하게 되었다. ^^
ㅁ Kibana index 생성


ㅇ kibana 로그를 검색 할 수 있었다.
ㅁ 참고
Kubernetes에 EFK 설치 및 튜토리얼
이전 MLOps Toy 프로젝트를 진행할 때 자원 문제로 인해 EFK 및 Prometheus를 적용하지 못하였다. 이에 간단한 Flask의 log를 시각화하는 EFK를 적용해보고자 한다. EFK란? EFK stack은 Elasticsearch, Fluentd..
byeongjo-kim.tistory.com
'DevOps > Elasticsearch' 카테고리의 다른 글
| [Elasticsearch] Data Node 볼륨 병목현상 확인 및 처리 (0) | 2023.01.16 |
|---|---|
| [Elasticsearch] Elasticsearch rejected exception 분석 (0) | 2022.11.16 |
| [Elasticsearch] EFK 설치(minikube)-1 (0) | 2022.08.07 |
| [Elasticsearch] EFK(Elasticsearch, Fluentd, kibana)란 (0) | 2022.08.02 |
| [Elasticsearch] Elasticsearch DISK IO 병목현상 및 재기동 (0) | 2022.05.17 |


